
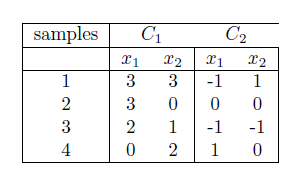
Sample Data:- Use following data set 1 and data set-2 for classifier using least square approach
Problem statement :- Sample program to find the linear classifier using least square approach.
Sample Output :-
[zytham@s158519-vm perceptron]$ python LSP.py
1. LeastSquareClassifier on Data points in Table 1
2. LeastSquareClassifier) on Data points in Table 2
Enter your choice:
1


 |
| Data Set -1 |
 |
| Data Set -2 |
Problem statement :- Sample program to find the linear classifier using least square approach.
import sys
import matplotlib.pyplot as plt
import pylab as pl
import numpy as np

def getMultiplePoints(x,y,weight,boundX1,boundX2):
 x1 =[x,0]
 x2 =[0,y]
 pointsX = []
 pointsY = []
 pointsX.insert(1,y)
 pointsX.insert(2,0)
 pointsY.insert(1,0)
 pointsY.insert(2,x)
 #for boundX1
 pointsX.insert(0,boundX1)
 temp = -(weight[0]*boundX1 + weight[2])/weight[1]
 pointsY.insert(0,temp)
 #for boundX2
 pointsX.insert(3,boundX2)
 temp = -((weight[0]*boundX2) + weight[2])/weight[1]
 pointsY.insert(3,temp)
 return (pointsX,pointsY)

#plot points
def getCoordinatesList(dataset,weightPlot):
 XList1 =[]
 YList1 =[]
 XList2 =[]
 YList2 =[]
 count = 0
 boundX = -4
 boundY =  4
 #compute classifier co-ordinates
 x1 = - (weightPlot[2]/weightPlot[1])
 y1 = 0
 x2 = 0
 y2 = - (weightPlot[2]/weightPlot[0])
 itr = len(dataset)/2
 # compute some random point with slope as W and bias b
 plotTup = getMultiplePoints(x1,y2,weightPlot,boundX,boundY)
 for row in dataset:
  if(count< itr):
   XList1.append(row[0])
   YList1.append(row[1])
  else:
   XList2.append(row[0])
   YList2.append(row[1])
  count = count+1
 return (XList1, YList1,XList2, YList2,plotTup)

def plotDataPointsAndClassifier(plotData,weightPlotLS):
 boundX = -4
 boundY =  4
 colorLS = 'black'
 (XList1, YList1,XList2, YList2,plotTupLS) =
  getCoordinatesList(plotData,weightPlotLS)
 #Draw points with red and Blue color
 plt.plot(XList1, YList1, 'ro',XList2, YList2, 'bo')
 plt.axis([boundX, boundY, boundX, boundY])
 plt.plot(plotTupLS[0],plotTupLS[1],color = colorLS,label='Least Square')
 plt.legend(loc='best')
 plt.show()

def compute(row, weights):
 bias = weights[2]
 output = bias
 for i in range(len(row)-1):
  output += weights[i] * row[i]
 if row[2] == 1 and output > 0:
  return True
 elif row[2] == -1 and output <= 0:
  return True
 else:
  return False

#compute b to such data data point are segrated
def getB(dataset,weights):
 flag = True
 epoch = 1
 while(True):
  flag = False ; epoch = epoch + 1
  for row in dataset:
   prediction = compute(row, weights)
   if not prediction:
    weights[2] = row[2] -(weights[0]*row[0]+weights[1]*row[1])
    flag = True
  if epoch == 10 or flag == False :
   break
 return weights

# To find classifier Minimum Squared Error Procedures - using Pseudoinverse
def LeastSquareClassifier(inputData):
 #Compute b based on input size. B is 1x<size> matrix with 1
 size = len(inputData)
 b = [1 for x in range(size)]
 #find b's transpose - > 8x1 matrix
 bt = np.matrix(b).getT()
 #Prepare input matrix from dataset
 m = np.matrix(inputData)
 #find tranpose of input matrix
 t = m.getT()
 #Multiply transpose of input matrix and matrix -  (Y^tY)
 mul = t*m
 #find inverse of outcome of above operation - (Y^tY)^-1
 inv = mul.getI()
 # Find pseudo inverse- Multiply inversed matrix with
 #transpose of input matrix - (Y^tY)^-1Y^t
 secondMul = inv * t
 #find solution matrix - Multiply pseudo matrix with b
 f = secondMul * bt
 #compute weight for ploting classifier
 weightPlot = []
 weightPlot.insert(0,f.item(1))
 weightPlot.insert(1,f.item(2))
 weightPlot.insert(2,f.item(0))
 return weightPlot

def ClassifierOnTable1():
 #Find least square classifier weight
 inputData = [[1,3,3], [1,3,0],[1,2,1] ,[1,0,2] ,
   [-1,1 ,-1],[-1,0, 0],[-1,1,1],[-1,-1 ,0]]
 plotData =  [[3,3,1], [3,0,1],[2,1,1] ,[0,2,1] ,[-1 ,1,-1],
   [0, 0,-1],[-1,-1,-1],[1,0,-1]]
 # find classifier for given dataset and Plot it.
 weightPlotLS = LeastSquareClassifier(inputData)
 #plot data points and classifier
 plotDataPointsAndClassifier(plotData,weightPlotLS)

def ClassifierOnTable2():
 inputData = [[1,3,3], [1,3,0],[1,2,1] ,[1,0,1.5] ,
   [-1,1 ,-1],[-1,0, 0],[-1,1,1],[-1,-1 ,0]]
 plotData  = [[3,3,1], [3,0,1],[2,1,1] ,[0,1.5,1] ,[-1 ,1,-1],
   [0, 0,-1],[-1,-1,-1],[1,0,-1]]
 # find classifier for given dataset and Plot it.
 weightPlotLS = LeastSquareClassifier(inputData)
 #plot data points and classifier
 plotDataPointsAndClassifier(plotData,weightPlotLS)

# map the inputs to the function blocks
options = {
  1 : ClassifierOnTable1,
  2 : ClassifierOnTable2,
 }
#start
if __name__ == '__main__':
 Dataset1C1 = [ [3,3], [3,0],[2,1] ,[0,1.5]]
 Dataset1C2 = [[-1 ,1],[0, 0],[-1,-1],[1 ,0]]
 print "1. LeastSquareClassifier on Data points in Table 1 \n \
  2. LeastSquareClassifier) on Data points in Table 2 \n"
 print "Enter your choice:\t"
 num = int(raw_input())
 options[num]()
Sample Output :-
[zytham@s158519-vm perceptron]$ python LSP.py
1. LeastSquareClassifier on Data points in Table 1
2. LeastSquareClassifier) on Data points in Table 2
Enter your choice:
1

[zytham@s158519-vm perceptron]$ python LSP.py
1. LeastSquareClassifier on Data points in Table 1
2. LeastSquareClassifier) on Data points in Table 2
Enter your choice:
2

Tags:
MLandAI
Mua vé máy bay tại Aivivu, tham khảo
ReplyDeletevé máy bay đi Mỹ
bán vé máy bay từ mỹ về việt nam
vé máy bay khứ hồi từ đức về việt nam
giá vé máy bay nhật việt vietnam airline
Máy bay từ Hàn Quốc về Việt Nam
từ canada về việt nam quá cảnh ở đâu
khách sạn cách ly ở vân đồn
vé máy bay chuyên gia nước ngoài
DBB265E51D
ReplyDeletekiralık hacker
hacker arıyorum
belek
kadriye
serik
EDEDE57D3E
ReplyDeletehacker kiralama
hacker bul
tütün dünyası
hacker bulma
hacker kirala